
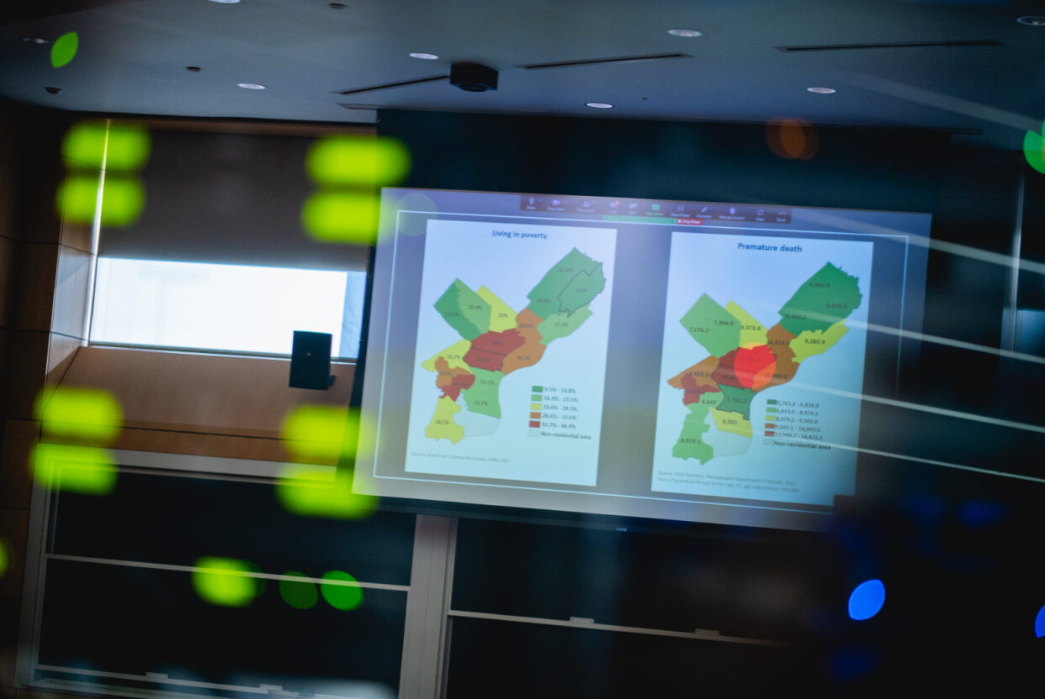
Join the College of Public Health s Epidemiology & Biostatistics department for a Data Visualization Sample Class hosted by the MS in Public Health Data Science Program Director, Dr. Recai Yucel. This session offers a glimpse into our graduate programs and focuses on data visualization using R and ggplot2. During the class, you'll learn how to:
- Produce scatterplots, boxplots, and density plots using ggplot2
- Modify plot aesthetics, such as axis labels and colors
- Build complex and customized plots from data
This Sample Class will also include tips and information on the application process from an admissions representative.
This event will be hosted via Zoom. Log-in information will be distributed to registrants prior to the event so be sure to sign up today!